POWEREDLANDUSAPROJECT FOOTHOLD · NORTH CAROLINA
AI / GPU Compute Infrastructure — North Carolina

Project
Foothold

A ±207-acre data center campus anchored by a live 18 MW compute facility, an on-site utility substation and $0.062/kWh all-in power proven across 17 reconciled utility billing cycles — one hour from Charlotte and minutes from an operating hyperscale campus. Offered at $25M — $14M at closing, the balance paid per megawatt of incremental capacity as it energizes.

0MW live today
0MW committed · 2028
0MW campus potential
0Acres ± · one campus
01 — Overview

Not a rendering.
18 MW running today.

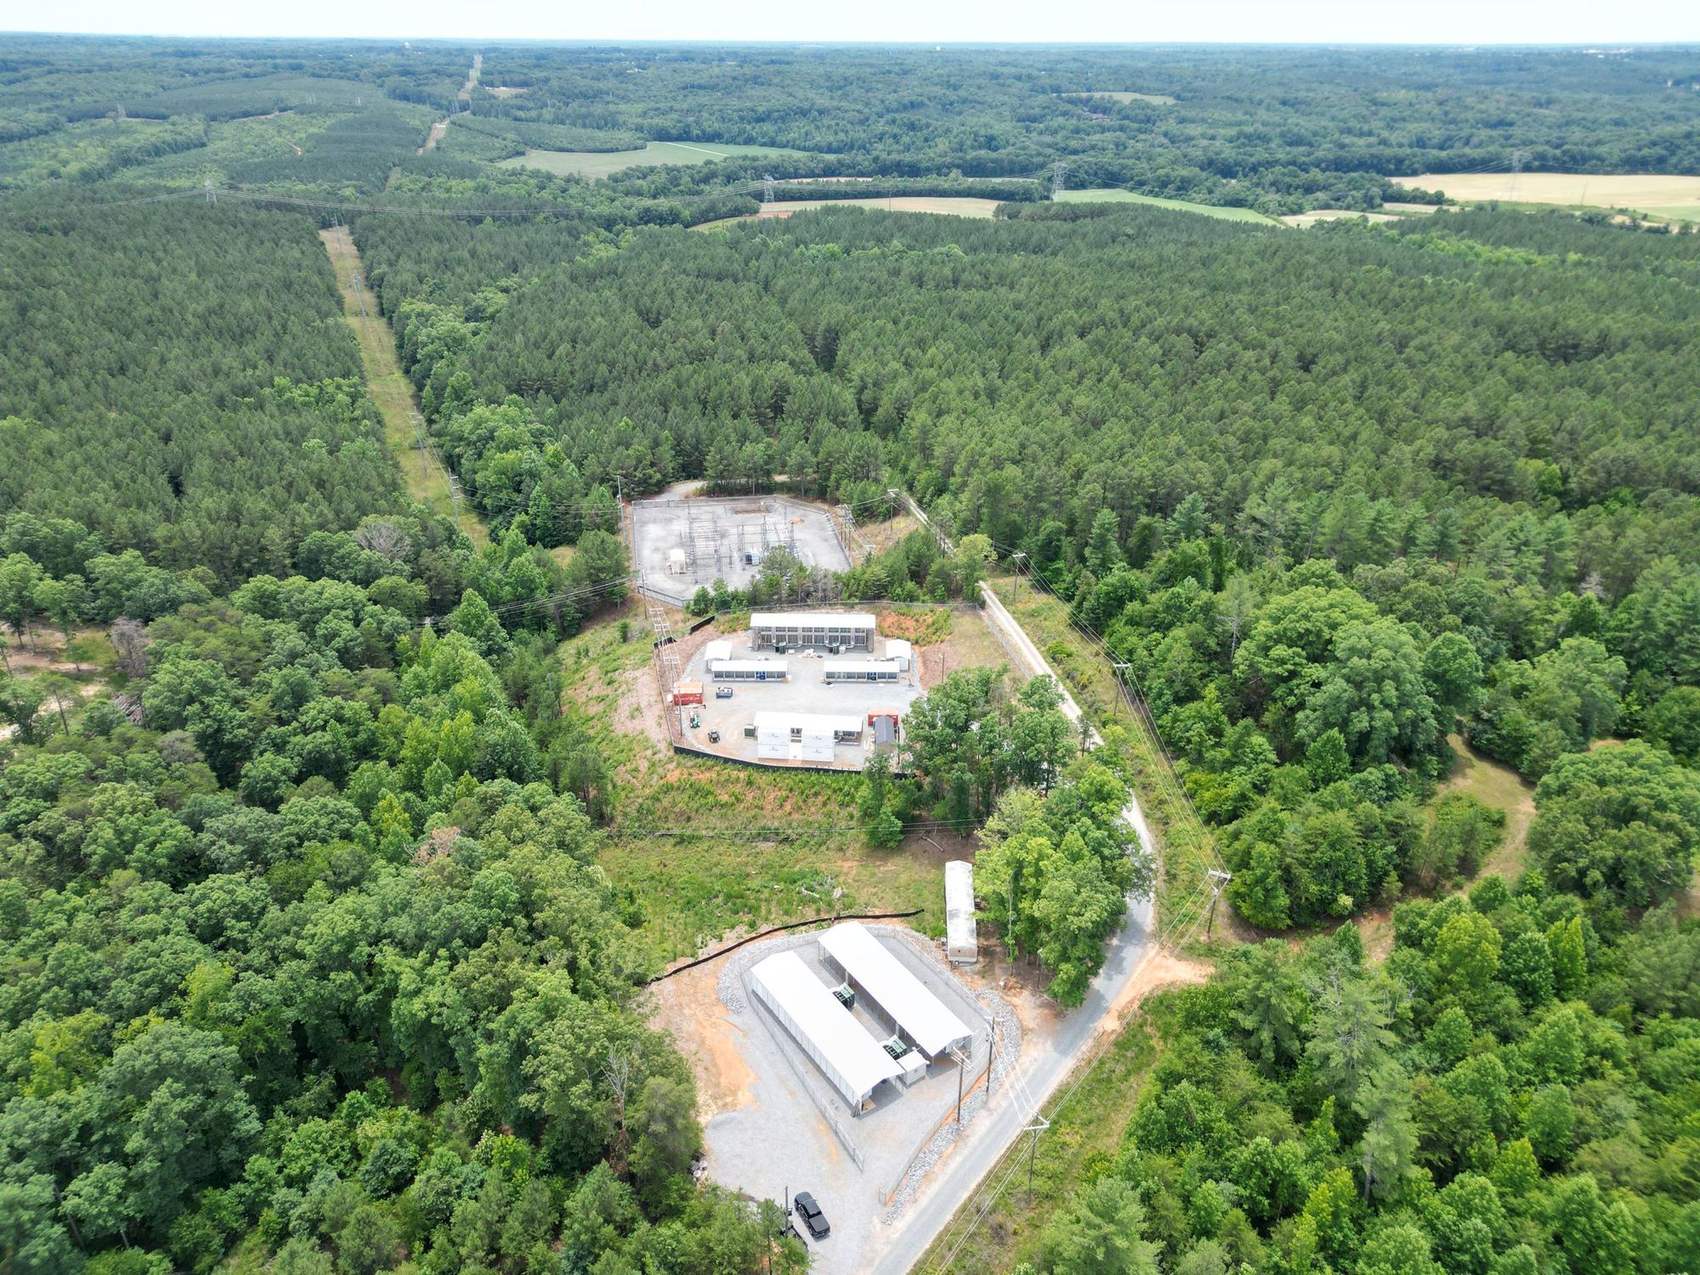
Project Foothold pairs land at hyperscale proportions with infrastructure that is already energized. An active high-load compute operation has validated the power chain end to end — substation, 21 MVA of installed transformation, and modular AI capacity — while ~204 acres of studied, shovel-ready land carry the campus to 100+ MW.

02 — The Campus · Lot Plan

One campus, ±207 acres.
Three tracts.

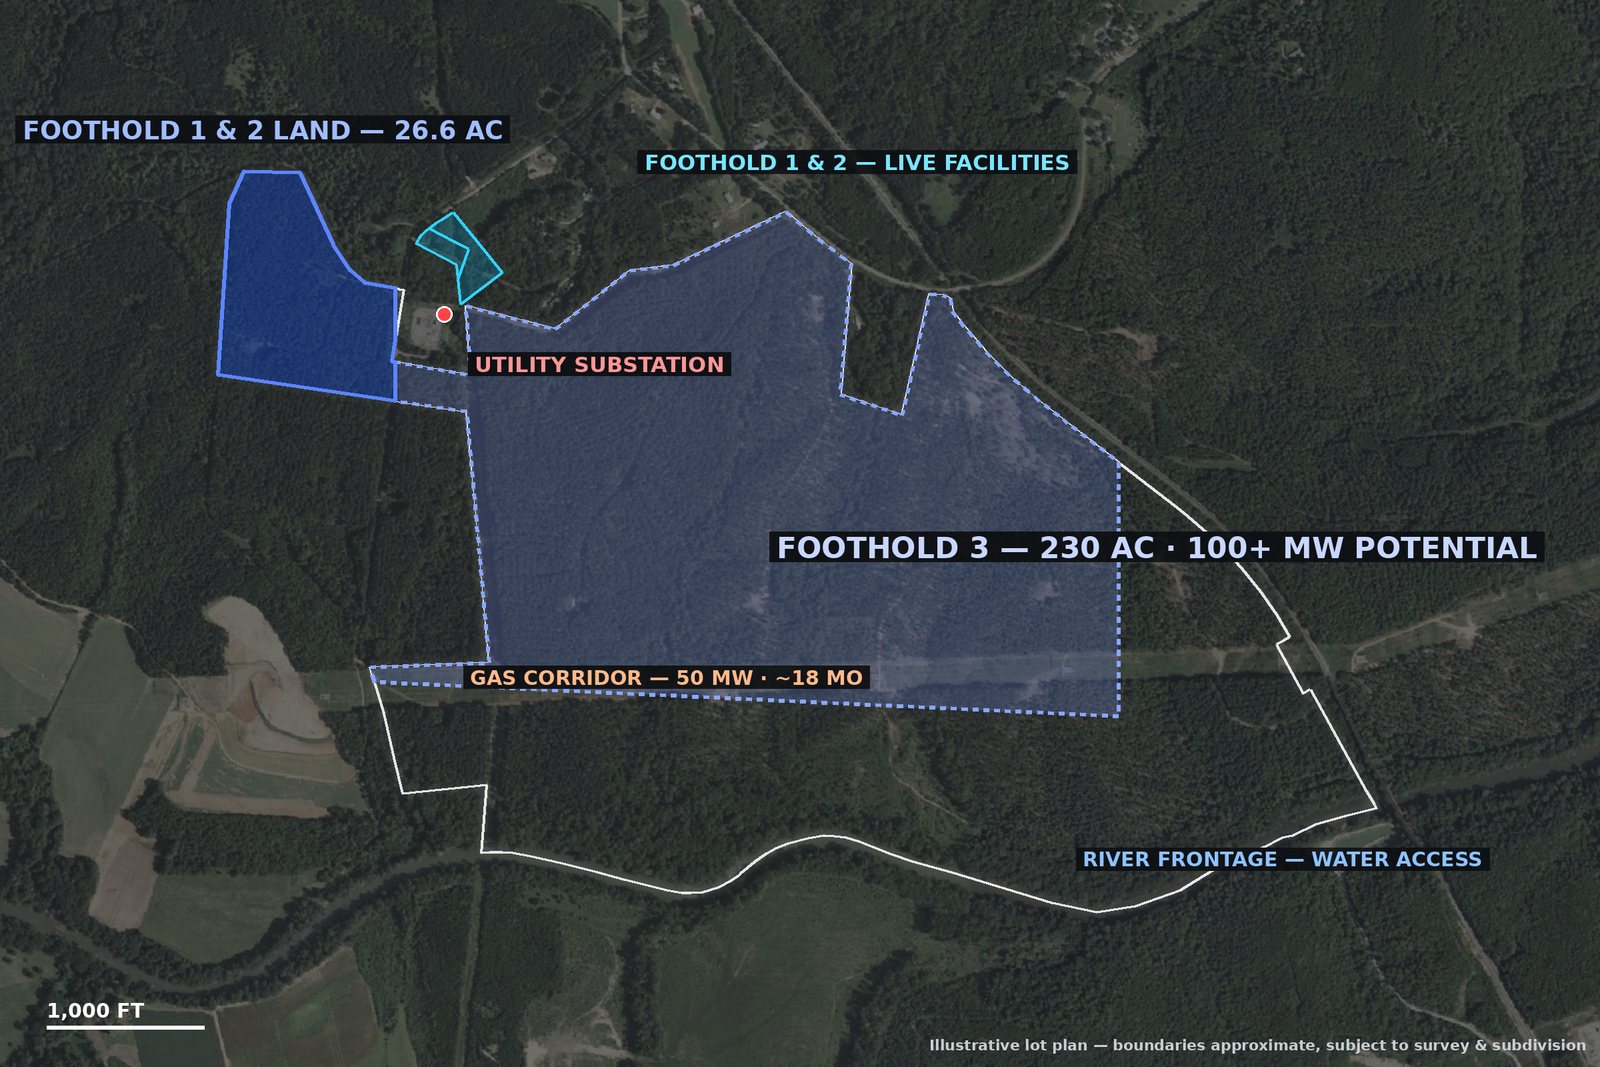
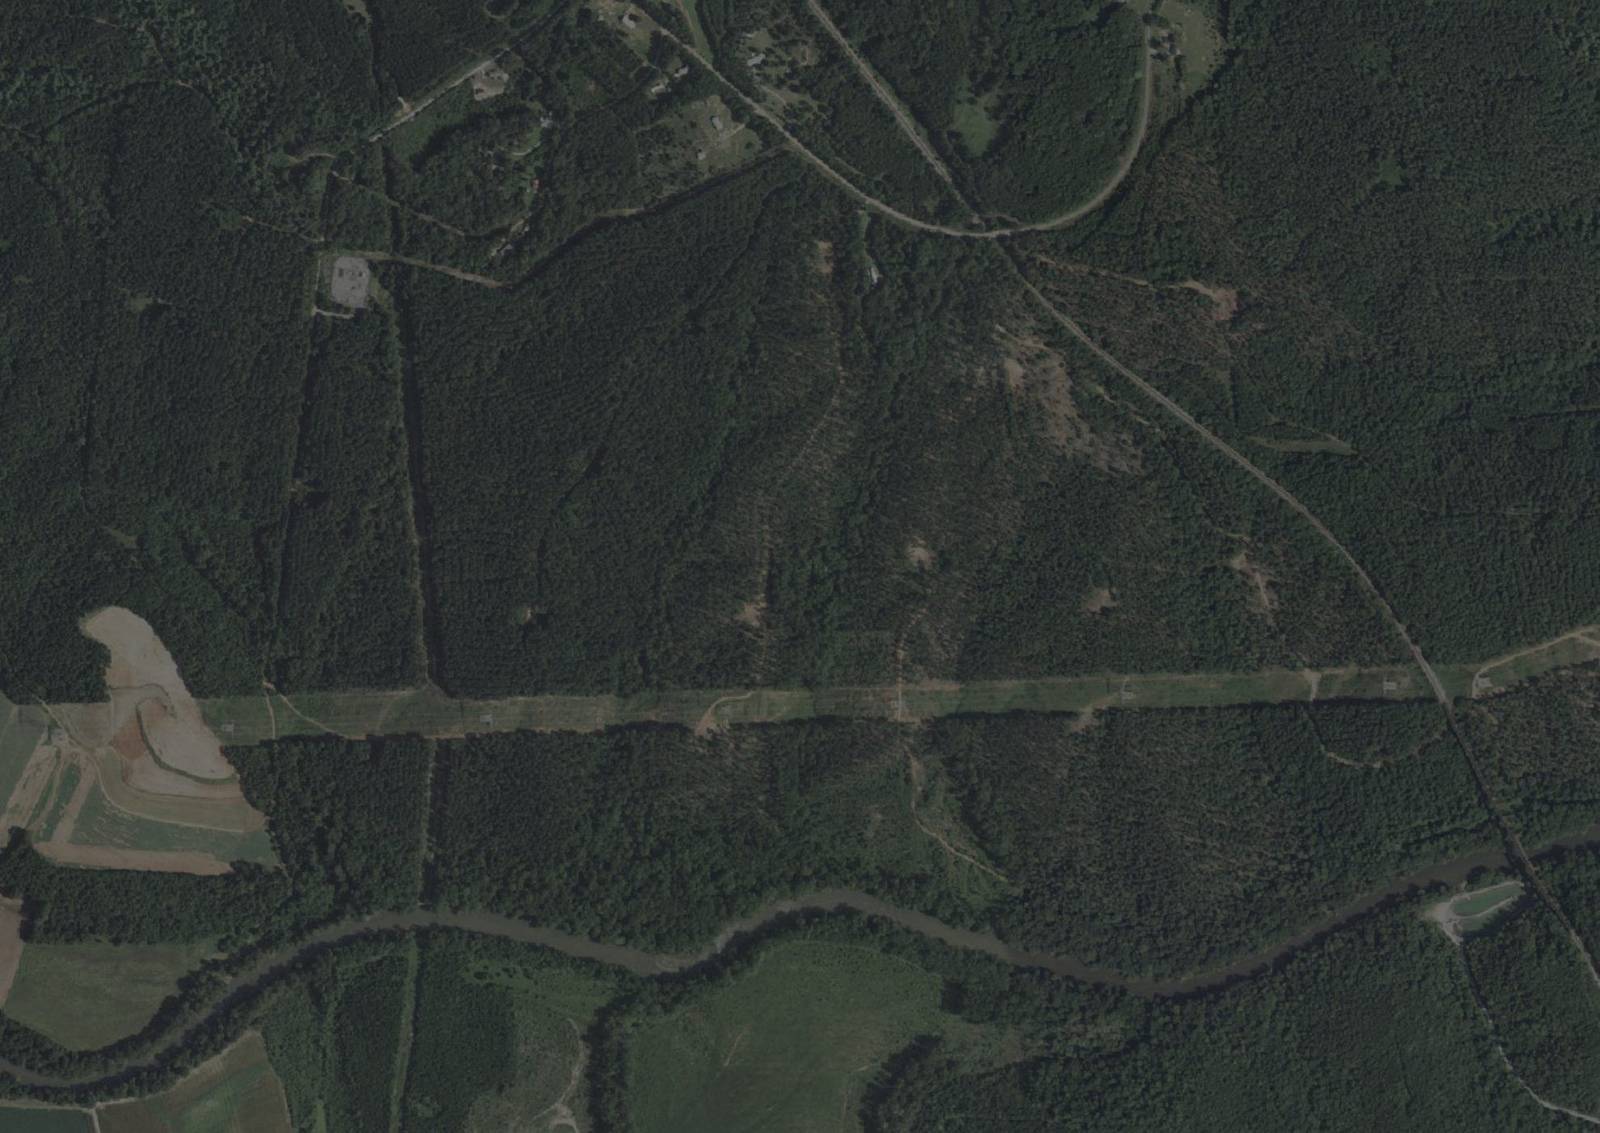
Real parcel geometry, mapped. The core offering is ±207.1 acres in three tracts: the two live facility pads (Foothold 1, 1.00 ac and Foothold 2, 2.10 ac, both per recorded deed) and Foothold 3 — a ~204-acre development tract bounded by the interstate gas corridor, net of a 26-acre lobe consolidated into the operating pads. Site entry, the corridor and the river frontage are traced on the map. Hover or tap each lot.

Aerial map of the Project Foothold campus, North Carolina utility substation UTILITY SUBSTATION FOOTHOLD 3 — ~204 AC FOOTHOLD 1 & 2 + 26-AC LOBE SITE ENTRY — FOOTHOLD RD INTERSTATE GAS — 50+ MW · ~18 MO TO ENERGIZE RIVER FRONTAGE — WATER ACCESS IMAGERY: USGS · PARCELS: NC ONEMAP · APPROXIMATE — SUBJECT TO SURVEY

LOT PLAN IS ILLUSTRATIVE. FINAL CARVE-OUT BOUNDARIES SUBJECT TO SURVEY, SUBDIVISION APPROVAL AND DEFINITIVE DOCUMENTATION.

Tract schedulePad acreages per recorded deed · tract acreages subject to survey
TractBasisAcres
Foothold 1 — facility pad · 12 MW in serviceRecorded deed1.00
Foothold 2 — facility pad · 6 MW in serviceRecorded deed2.10
Foothold 3 — development tractSubject to survey230.00
Campus gross233.10
Less: 26-acre west lobe consolidated into Foothold 1 & 2(26.00)
Net campus offered±207.10
Additional land available — balance of the parent parcel, to be subdivided~196.80
Total land under common control~429.90

How to read this. Foothold 1 and Foothold 2 are separately deeded parcels and their acreages are taken from the recorded deeds, not from an estimate. Foothold 3 is carved from the adjoining parent parcel, which title and the ALTA survey put at 426.78 acres in total; the 26-acre west lobe comes out of that carve and is consolidated with the two operating pads, so it sits outside the net figure. The remaining ~196.8 acres of the parent parcel is available to purchase in addition to the core offering — it has not been surveyed as a separate tract, would be subdivided at the buyer's election, and is priced per acre at fair market value, not on the energization ladder. Capacity-linked pricing attaches to the interconnection position, not to raw acreage. Boundaries shown on the map are the offering geometry, not a recorded plat.

03 — The Properties

Foothold 1 · 2 · 3

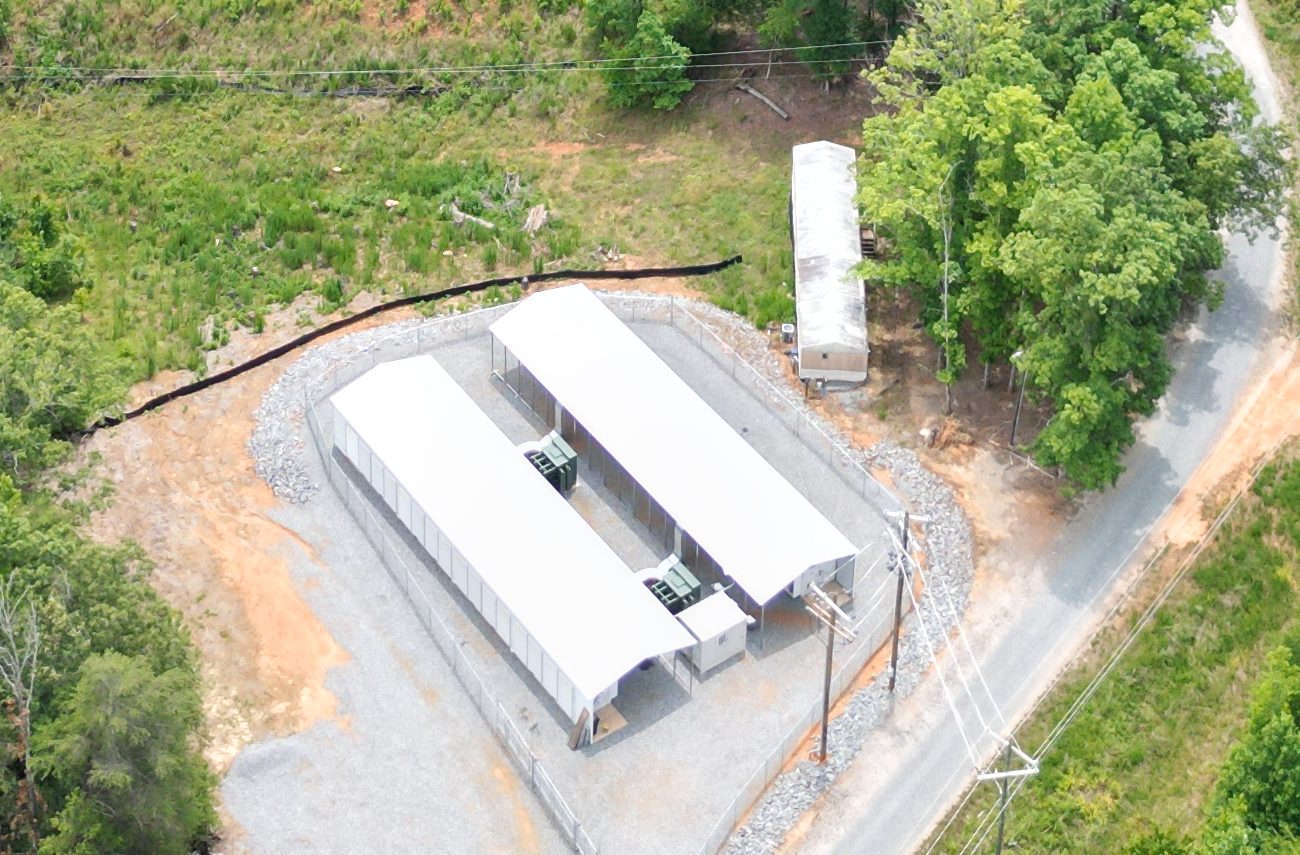
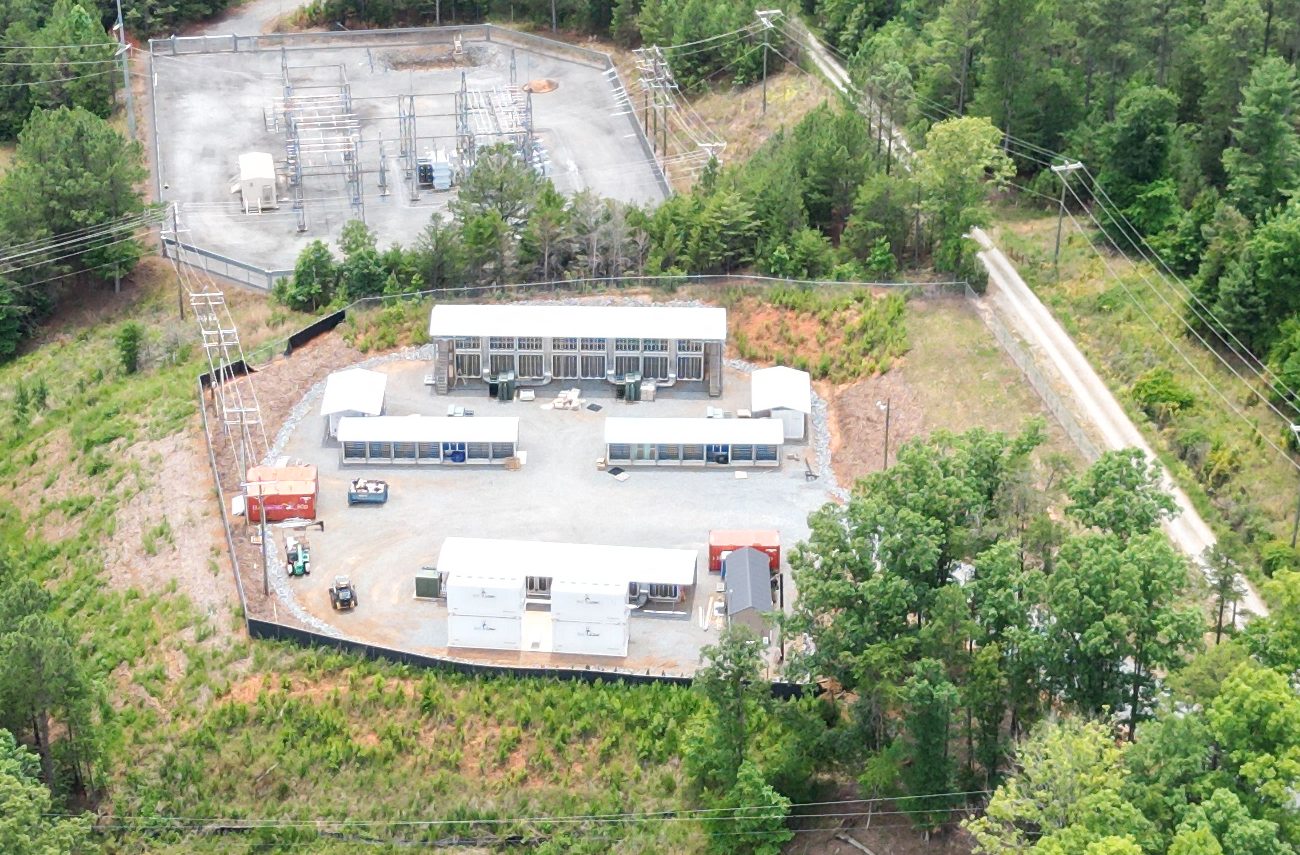
LiveDrone view of the Foothold 1 facility beside the utility substationS-01

Foothold 1

12 MW — IN SERVICE · 1.00-AC DEEDED PAD

The anchor facility. An active high-load compute operation drawing 12 MW through the on-site utility substation — proof, at utility scale, that the power chain performs.

StatusOperational
Capacity12 MW
UtilityOn-site substation
UseHigh-load compute
LiveDrone view of the Foothold 2 compute halls, adjacent to Foothold 1S-02

Foothold 2

6 MW — IN SERVICE

Directly beside Foothold 1 — the second energized facility brings the live core to 18 MW, with modular AI compute containers deployed on its pad.

StatusOperational
Capacity6 MW
CoolingAir-cooled
AI Racks16 × 20 kW
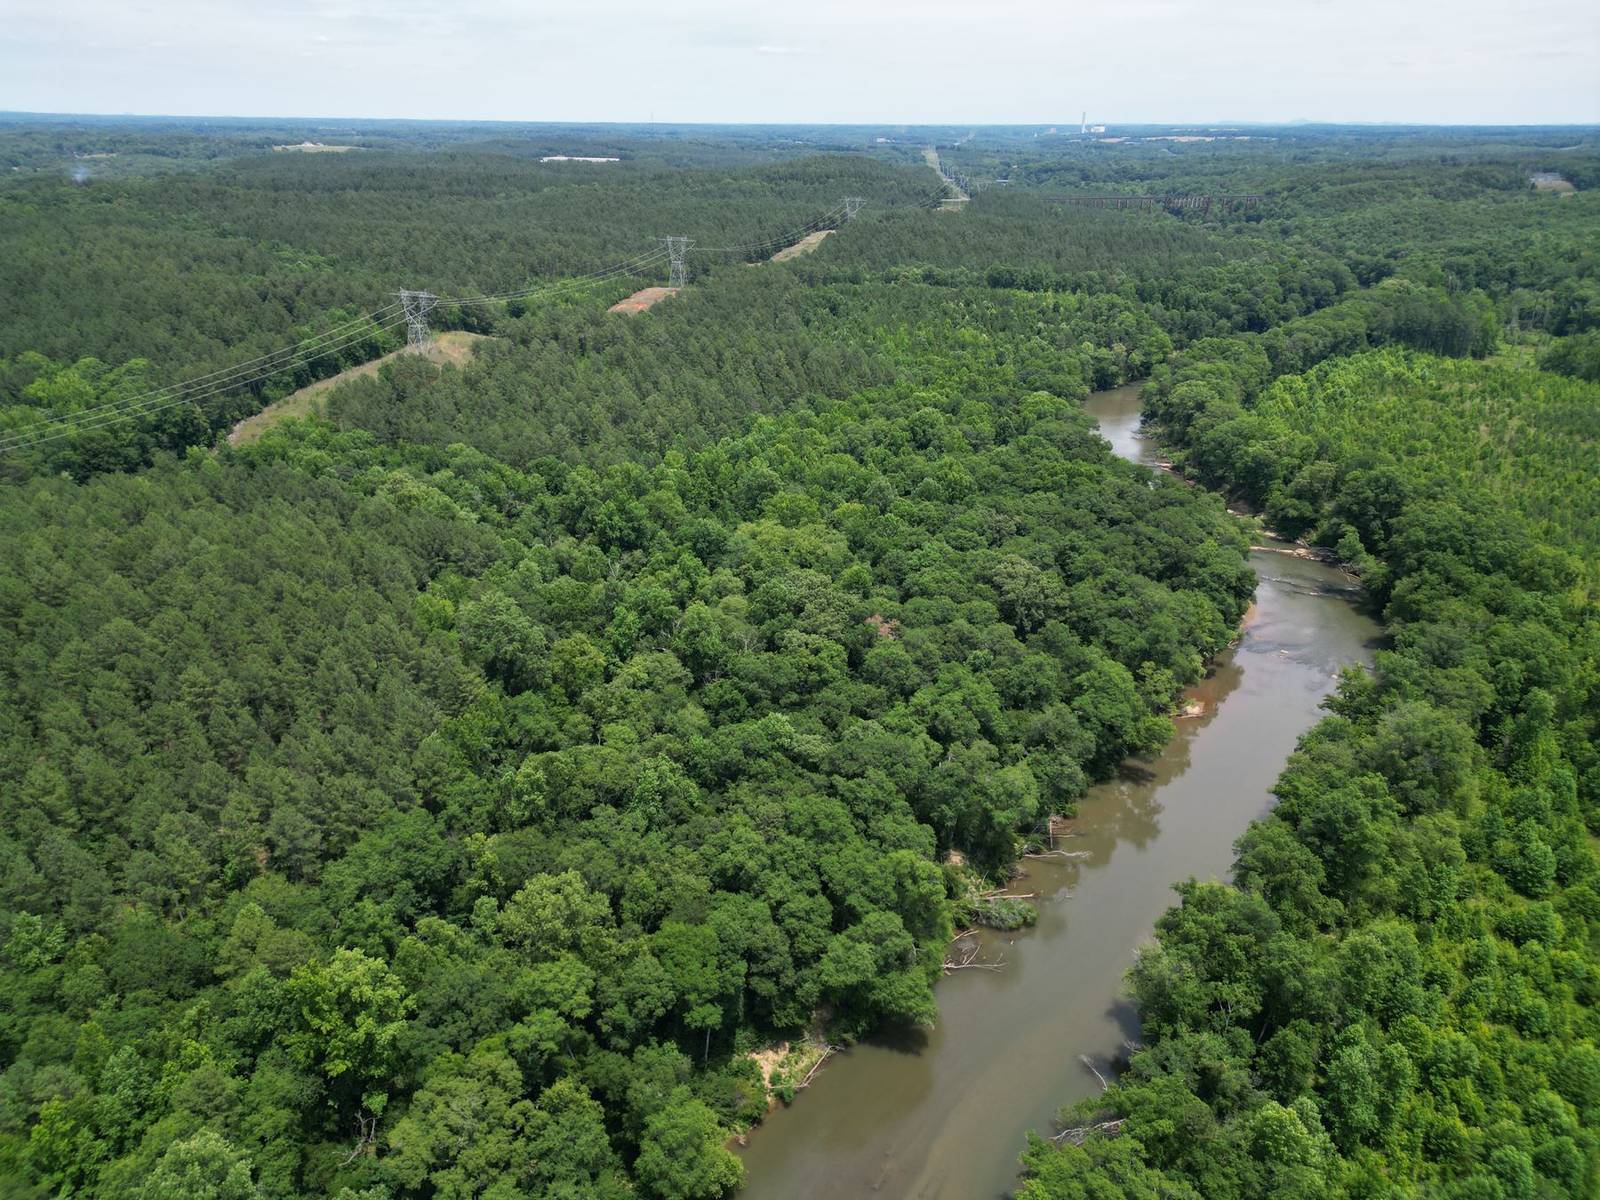
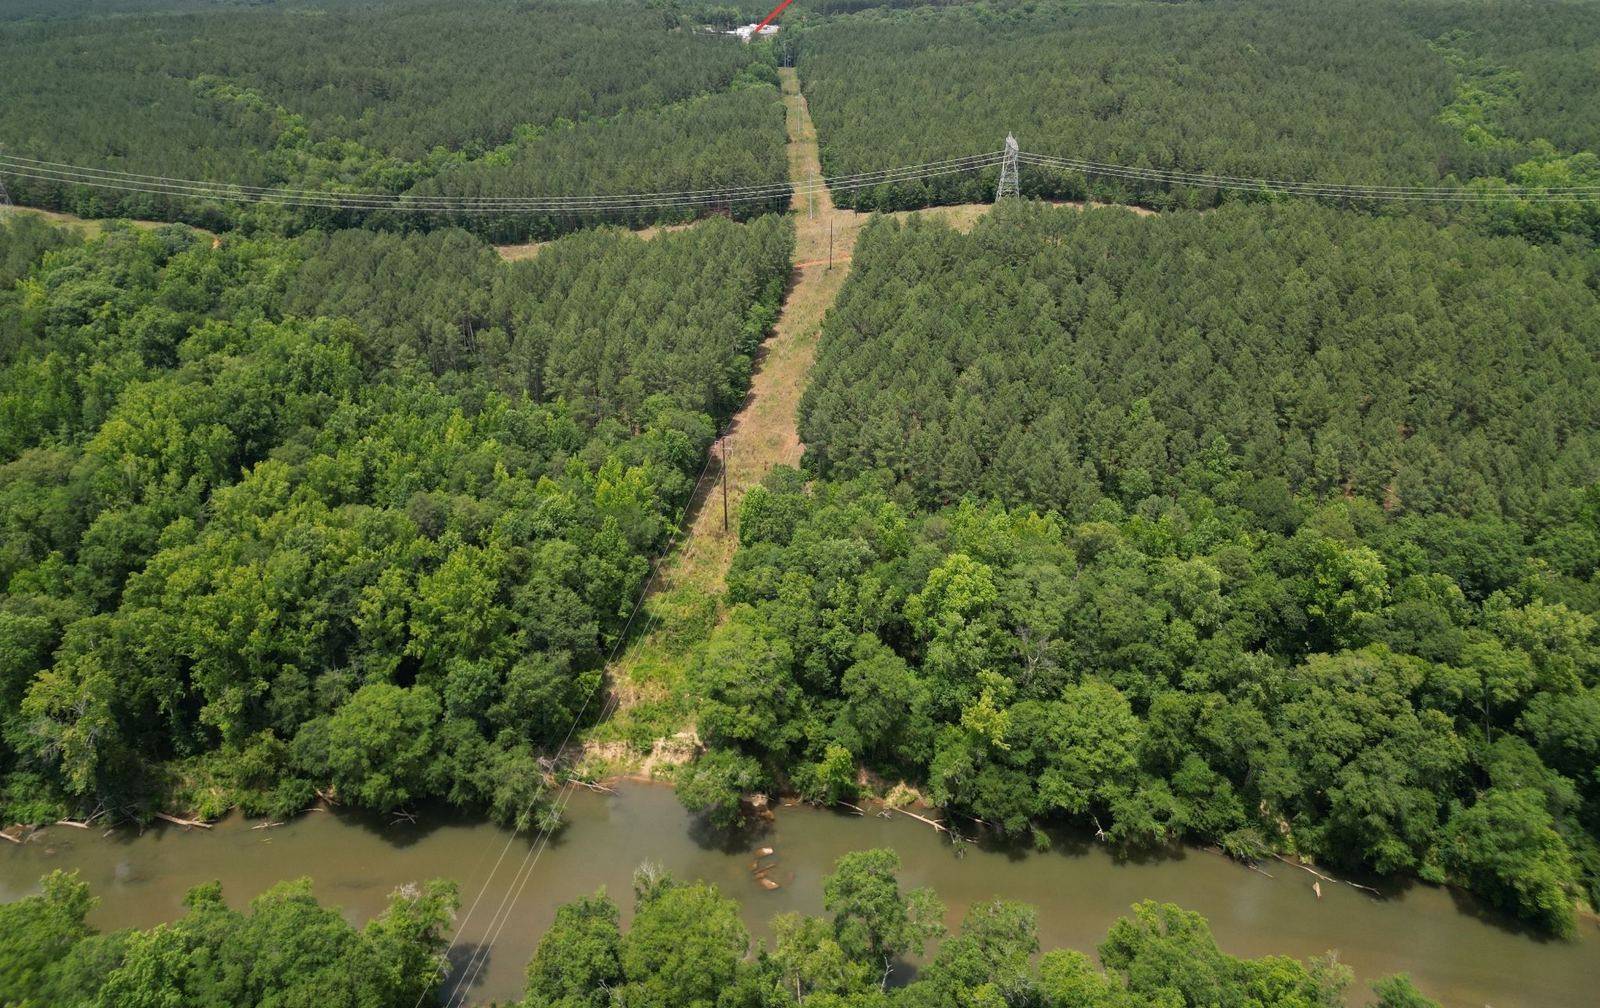
ExpansionAerial view of the Foothold 3 land along the riverS-03

Foothold 3

~204 ACRES — 100+ MW POTENTIAL

The campus land. A secluded, studied, shovel-ready expansion canvas with river frontage, dual-fiber connectivity, natural gas at the corridor and a clear path to 100+ MW.

StatusShovel-ready
Studies7 complete
Waterregional access
Gasinterstate ext.
04 — Power Infrastructure

Energized today.
Expanding to 30 MW.

Immediate access to large-scale power from the regional utility — substation on site, transformation installed, expansion executed.

0MW live capacity
0MVA installed — 7 × 3,000 kVA
0V primary · 415 V distribution
0MW by 2028 — utility LOA
$0.062/kWh
Industrial Power Rate

Blended all-in cost across 17 reconciled utility billing cycles — energy, demand, riders and taxes, net of demand-response credits. These are billed figures taken off the actual invoices, not a tariff estimate, and they sit before North Carolina’s 100% electricity sales-tax exemption for qualifying data centers.

6.0¢12 MW meter alone
4.2¢Energy-only commodity
95 GWhDelivered & billed
17Cycles reconciled
TODAY18 MW Live

Active compute across Foothold 1 & 2 — substation adjacency, 21 MVA installed, operations proven.

2028+12 MW Committed

Utility expansion executed — campus rises to ~30 MW for phased AI deployments.

FULL BUILD100+ MW Campus

Utility impact study underway across the campus; new substation pathway for hyperscale build-out.

05 — Utility Billing History

$0.062/kWh all-in.
From the bills, not an estimate.

Every figure below is reconciled from the actual utility invoices for the two campus meters. 17 billing cycles, 95.1 gigawatt-hours delivered, $5.88 million billed. Each cycle passes a penny check — energy plus demand plus riders plus fixed charges, net of demand-response credits, times the 7% rate, equals the billed total.

6.2¢/kWhBlended all-in · campus
4.2¢/kWhEnergy-only commodity
95GWhDelivered & billed
17Reconciled cycles
Monthly consumption & blended rateFoothold 1 (12 MW) + Foothold 2 (6 MW) · curtailment month excluded
9.7M7.3M4.9M2.4M0.0MAUGSEPOCTNOVDECJANFEBMARAPRMAYJUN5.7¢5.7¢7.3¢6.3¢¢/kWh
Foothold 1 — 12 MW Foothold 2 — 6 MW Blended ¢/kWh
Why the most recent cycle is not shown. A utility demand-response curtailment programme began mid-June 2026 (initially 5:30–9:30 PM, widening to 12–9 PM within days). The July cycle is therefore a partial-curtailment month and is not representative of unconstrained operation, so it is excluded from every figure on this page. It is included in full, with the curtailment schedule, in the data room.

Per-cycle detail is under NDAInvoice-level breakdown for all 17 cycles — on-peak / mid-peak / off-peak demand, energy, per-kWh riders, fixed facilities charges, demand-response credits, the demand ratchet on the 6 MW meter, and the load-factor series — is available in the secure data room alongside the executed service agreements and the interconnection letters.

Request data room access
06 — Zero-Carry Power Reservation

Land lease-back.
Reserved power, zero carry cost.

The active crypto-mining operation can remain on site under a land lease-back to the current owners — keeping the full 18 MW energized, revenue-covered and reserved while AI capacity phases in.

/ 01Mining stays — under lease-back

The current owners lease back the operating land and continue mining. No shutdown, no idle infrastructure, no interruption to the energized load.

Continuity
/ 02Power reserved at zero carry

The interconnection stays fully loaded and the 18 MW reservation carries itself — the incoming operator pays nothing to hold the power while planning its build.

$0 holding cost
/ 03Convert on your schedule

Mining load steps down hall by hall as AI capacity energizes — a phased, de-risked handover of the full 18 MW, on the tenant's timeline.

Phased handover
07 — Connectivity & Utilities

Up to 100G dual fiber.
Sub-6ms to the Southeast core.

Project Foothold FOOTHOLD SITE NORTH CAROLINA HYPERSCALE DC — 17 MIN N. Virginia~2.5 ms Raleigh~4 ms Richmond~5 ms Charlotte~5.5 ms Atlanta~6 ms Chicago~10 ms
Up to 100G Dual Fiber

Spectrum direct fiber physically on-property. Multiple 100G links provisionable as demand grows.

On-site
Redundant ISP Path

AT&T and Vyve Broadband approved to extend fiber — diverse-path redundancy for colocation-grade SLAs.

Approved
Water — the river Authority

Up to 8 MGD WTP capacity, 4.95 MGD WWTP and 3.3M-gal clearwell storage. Air cooling keeps demand minimal.

Available
Natural Gas — Interstate Operator

Industrial line at the southern corridor — supports 50+ MW of gas generation with a ~18-month path to energize.

50+ MW
Site Entry & Logistics

Direct paved entry from a state road; two US highway corridors minutes away and interstate access within ~30–45 minutes.

On-site
08 — AI-Ready Deployment

GPU racks on the ground.
Not on a roadmap.

A live proof-of-concept program is validating the site for GPU compute: two air-cooled containers at 20 kW per rack are on the ground today, with a 60 kW-per-rack container incoming.

Modular Containers

Two self-contained AI compute containers installed — proof-of-concept units validating power, cooling and network at production load.

20 kW → 60 kW Racks

16 racks live at 20 kW each (~320 kW), with a next-generation 60 kW-per-rack container incoming to prove high-density deployment.

Air-Cooled

Optimized for high-density GPU loads in a mild foothills climate — no large-scale water agreements required.

Proven High Load

Continuous high-load operation at 18 MW validates power quality, cooling and network in production.

Interactive · live model The full deployment plan

Drag racks against a real 20 kW ceiling. Change the RAM tier or the firewall and every table, gauge and figure on the page re-prices in front of you. Full bill of materials at street pricing, thermal and power headroom, third-party hardware picks, a returns model with capital-recovery schedule, and the complete build-out sequence.

320 kWTier 2 · deployable today · $0.15/kWh 160 kWTier 1 · deployable today · $0.28/kWh up to 100Gdual fiber
Open the plan

Not buying the campus? Host on the infrastructure that is already running →

09 — North Carolina Advantage

North Carolina tax incentives.
Tier 1 county, top-5 DC state.

The county's Tier 1 designation unlocks North Carolina's deepest incentive stack — in a state with $13B+ of data center investment since 2020 and 6,500+ MW in development.

100%Sales Tax Exemption — Equipment

Full state & local sales/use tax exemption on qualifying data center equipment and software.

100%Sales Tax Exemption — Electricity

Qualifying data centers eliminate NC's 7% electricity sales tax — material savings at scale.

0%NC Corporate Income Tax by 2030

2% in 2026 → 1% in 2028 → 0% in 2030. A structural, legislated glide path.

Lowest tierProperty Tax Rate

Among the lowest county rates in North Carolina — and no state-level property tax.

39%New Markets Tax Credit

The county qualifies as a low-income community — 7-year federal credit on qualified equity investment.

Tier 1Maximum State Incentives

Highest JDIG withholding rates, One NC Fund eligibility and priority for EDA infrastructure grants.

INCENTIVE PROGRAMS AND THRESHOLDS SUBJECT TO LEGISLATIVE CHANGE AND PROGRAM QUALIFICATION. CONFIRM CURRENT REQUIREMENTS WITH THE NC DEPARTMENT OF COMMERCE.

10 — Due Diligence

Diligence studied.
Then disclosed.

An institutional-grade diligence file already exists on this land, commissioned by a prior utility-scale developer and executed by national third-party consultants. We publish the constraints it found alongside the clearances — buyers find them in diligence anyway, and the math still works.

2022Phase I Environmental Site Assessment

ASTM E1527-13, licensed environmental professional. No RECs, CRECs or HRECs identified. Reliance letters on file.

2023Preliminary Geotechnical Investigation

National geotechnical firm. Borings, subsurface profile, groundwater, field & laboratory thermal resistivity, seismic site class, corrosion series.

2023Hydrology & Flood Study

HEC-RAS 2D model of the 100-year, 24-hour storm — flood depths, velocities and scour under existing conditions.

2023Soil Corrosivity — 40-Year Design Life

Independent corrosion engineering review of soil data with long-term below-grade control recommendations.

2021Wetland Delineation + Federal Verification

Full delineation with a USACE Preliminary Jurisdictional Determination on file. Streams and wetlands surveyed and mapped.

2021Archaeological Survey + SHPO Concurrence

State Historic Preservation Office concurrence received. No unassessed site falls within the Foothold 3 tract.

2020-21Protected Species Assessment (USFWS)

Limited NEPA assessment with US Fish & Wildlife consultation; potential habitat mapped and buffered.

2021-22ALTA Survey, Title Commitment & Policy

ALTA/NSPS survey, title commitment, issued loan policy of title insurance, recorded deed and full chain of title.

~182Acres unconstrained89% of the ~204-acre net tract
What the studies found — stated plainly

21.6 acres of Foothold 3 carry mapped avoidance areas: buffered potential habitat for a federally threatened plant species, which follows the drainages, and the delineated streams and wetlands within them. They are surveyed, GPS-mapped and shown on the campus map — toggle Avoidance areas in the legend.

These are siting constraints, not entitlement blockers: they concentrate along drainages at the tract edges, leaving the interior contiguous. Four archaeological sites elsewhere in the wider assemblage remain unassessed — none of them lie within Foothold 3.

Reports were commissioned by and addressed to a prior developer for a solar use case; geotechnical recommendations are scoped to that program and data-center foundation loads require supplemental analysis. The USACE determination and Phase I are dated and refreshable. Reliance is not automatically transferable — new reliance letters are obtainable from the issuing consultants. Full reports are available in the data room under NDA.
11 — Data Room

Full data room.
Under NDA.

The complete studies, survey, title work and site documentation are held in a secure data room. Access is granted individually to qualified parties under confidentiality terms — request access and we typically review the same business day.

  • Phase I ESA + reliance letters
  • Geotechnical report & boring logs
  • Hydrology / flood modeling
  • Wetland delineation & USACE determination
  • Archaeological survey & SHPO correspondence
  • Protected-species assessment & avoidance mapping
  • ALTA survey, title commitment & policy
  • GIS shapefiles, slope, soils & aerial sets
12 — The Offering

Acquisition structured
for speed.

Project Foothold — the live facilities, the Foothold 1 & 2 land package and the ~204-acre Foothold 3 development tract, with a further ~196.8 acres available — offered as a single transaction. Cash at close, then payment per megawatt of incremental capacity as and when it actually energizes.

AT CLOSING$14.0M

Paid at close — fee title to the campus and control of 18 MW of live, revenue-capable capacity from day one.

ON ENERGIZATION$/MW

The balance is paid per megawatt of incremental capacity actually energized above the current 18 MW — priced on a sliding scale indexed to the year it energizes. You pay for power when you get power.

WHY IT IS STRUCTURED THIS WAYRisk sits with us

Capacity that never energizes is never paid for. The seller carries the interconnection risk and is paid only on delivery — and paid more for delivering sooner.

Energization ladderPer MW of incremental capacity, by year energized
Energized byPer MWRationale
2028$500,000Matches the committed utility date — capacity delivered on schedule is worth the most to a buyer racing a deployment window.
2029$450,000Still inside the current scarcity window for available interconnection.
2030$300,000Value steps down as competing supply reaches the market.
2031$250,000 
2032$200,000Floor. Beyond this the incremental capacity is treated as unpriced optionality.

Worked example: if the committed +12 MW energizes in 2028, that tranche pays $6.0M. Capacity beyond it — the transmission-level expansion requiring a new substation — prices on the same ladder as and when it energizes. The ladder is the mechanism; the rate card is indicative and set in the definitive agreement. Land beyond the core campus is not priced on this ladder — additional acreage sells at per-acre fair market value, because the capacity premium attaches to the interconnection position rather than to the ground.

STRUCTURE INDICATIVE. THE ENERGIZATION LADDER IS THE PAYMENT MECHANISM; RATES, MEASUREMENT AND TERMS PER DEFINITIVE PURCHASE AGREEMENT. INCREMENTAL CAPACITY ABOVE 18 MW IS A SEPARATE TRANSMISSION-LEVEL INTERCONNECT REQUIRING A NEW SUBSTATION AND IS NOT AN EXPANSION OF THE EXISTING SERVICE.

14 — Engage

Deploy at
Foothold.

Pilot deployments, long-term leases, colocation and strategic joint ventures. Tell us about your workload and timeline — we'll respond with availability, engineering detail and a confidential site tour.

LocationNorth Carolina
Capacity18 MW live · ~30 MW 2028 · 100+ MW potential
Campus±207.1 ac core + ~196.8 ac optional
Offering$14.0M at closing + per-MW payments as new capacity energises
Power rate$0.062 / kWh all-in · 17 billed cycles
EngagementPilot · Lease · Colocation · JV
⤓ Download Site Brief (PDF)

SUBMISSIONS ARE CONFIDENTIAL. WE TYPICALLY RESPOND WITHIN ONE BUSINESS DAY.

Background reading

Open reference material on the category, the state incentive position, and the questions buyers ask first.

What is powered land? Definition, the grades of “powered”, and how to verify a claim North Carolina incentives Equipment and electricity tax exemptions, and the 0% corporate path Buyer FAQ Power available, cost per kWh, site size, connectivity and access

Last updated 7 August 2026